Your application is running, until it is not. Servers run out of disk space, certificates expire, third-party APIs fail, a release introduces an error that only affects checkout on one browser. The question is not whether problems will occur but who finds out first: you, or your customers. Monitoring is the discipline that makes sure it is you, quickly, with enough information to fix the problem. This guide describes a practical monitoring setup that works for small teams and grows with you.
Decide what "healthy" means
Start with the outcomes that matter. For an online store, that might be that pages load, customers can add to cart, checkout succeeds, and emails are sent. For a SaaS product, it might be that users can log in, the core workflow completes, and background jobs run on time. Define service level objectives such as "checkout succeeds 99.5 percent of the time" or "ninety-five percent of pages load in under two seconds." These give alerts meaning: you alert when you are at risk of missing the objective, not whenever a graph wiggles.

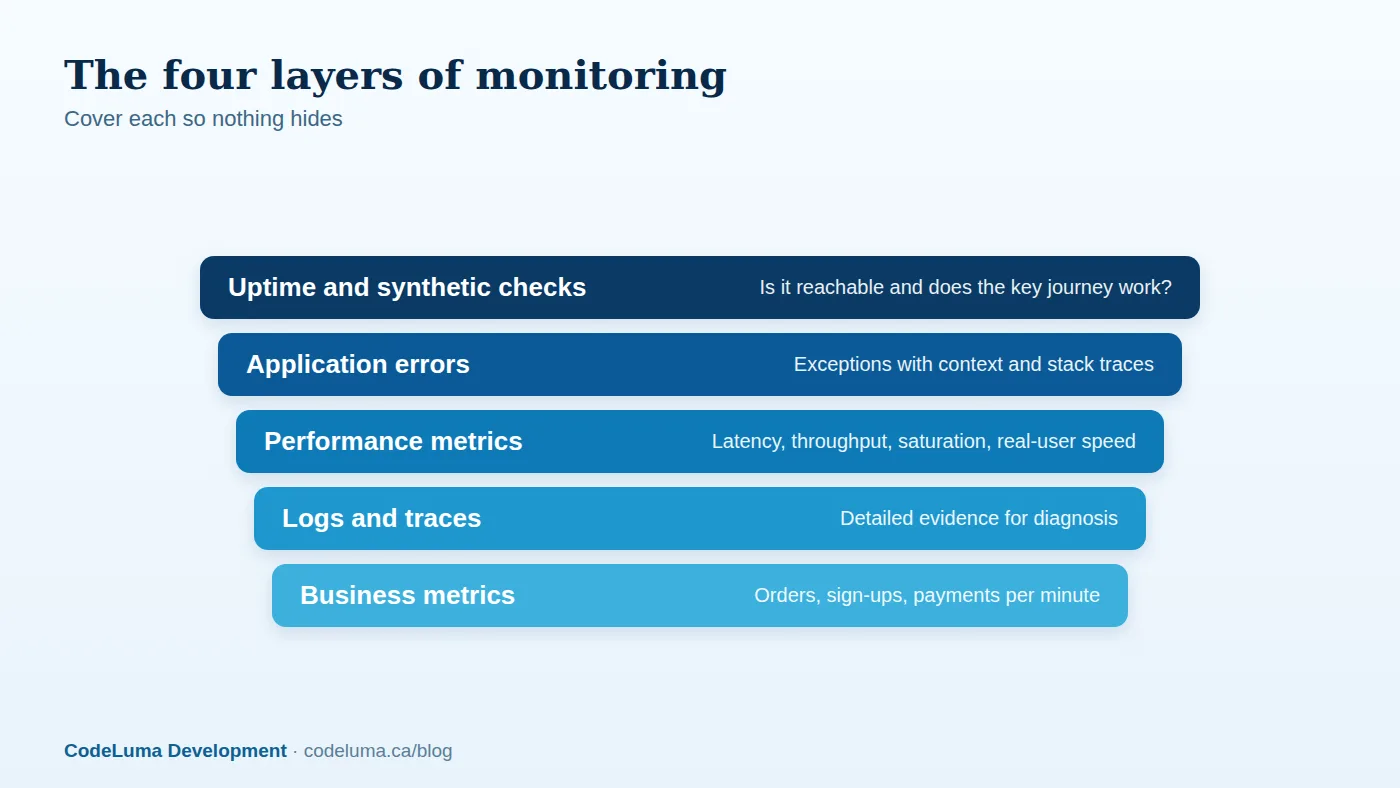
Layer one: uptime and synthetic checks
The simplest and most important monitor is an external check that requests your site from outside your network every minute or so and alerts if it fails. Check more than the home page: monitor a health endpoint that verifies the database and key dependencies, and use synthetic transactions that simulate a login or a checkout in a headless browser. Check from several regions to distinguish local network problems from real outages. Monitor SSL certificate expiry and domain expiry too, since these are among the most embarrassing and avoidable outages. We cover certificate and DNS pitfalls separately.
Layer two: application error tracking
Error-tracking tools capture exceptions from your application, group similar ones, and record context: stack trace, request details, user or account identifiers, the release version and browser information. They tell you that a specific error started after yesterday's deploy and affects two percent of users. Track front-end JavaScript errors as well as back-end exceptions, because many customer-facing problems occur in the browser. Configure sensible sampling and scrub personal data from reports to respect privacy.
Layer three: performance and infrastructure metrics
Collect metrics on the golden signals: latency, traffic, errors and saturation. For servers and containers, watch CPU, memory, disk space and network. For databases, watch connections, slow queries, replication lag and lock waits. For queues, watch depth and processing time. For the front end, collect real-user monitoring data such as Core Web Vitals segmented by page, device and country. Visualise trends on dashboards so slow deterioration, such as a memory leak or growing table, is visible long before it becomes an outage.
Layer four: logs and traces
Metrics tell you that something is wrong; logs and traces help you find why. Use structured logs, in a consistent format such as JSON, with request IDs so you can follow one request across components. Centralise logs in a searchable system with sensible retention, and never log secrets or sensitive personal data. Distributed tracing shows where time is spent across services and dependencies, invaluable for diagnosing slowness in multi-component systems.
Layer five: business metrics
Technical health does not guarantee business health. Track orders per minute, payment success rate, sign-ups, emails delivered and key workflow completions. A sudden drop in orders with no errors may indicate a broken button, a payment provider issue or a bad release. Business metrics catch problems that technical monitors miss.

Design alerts that people trust
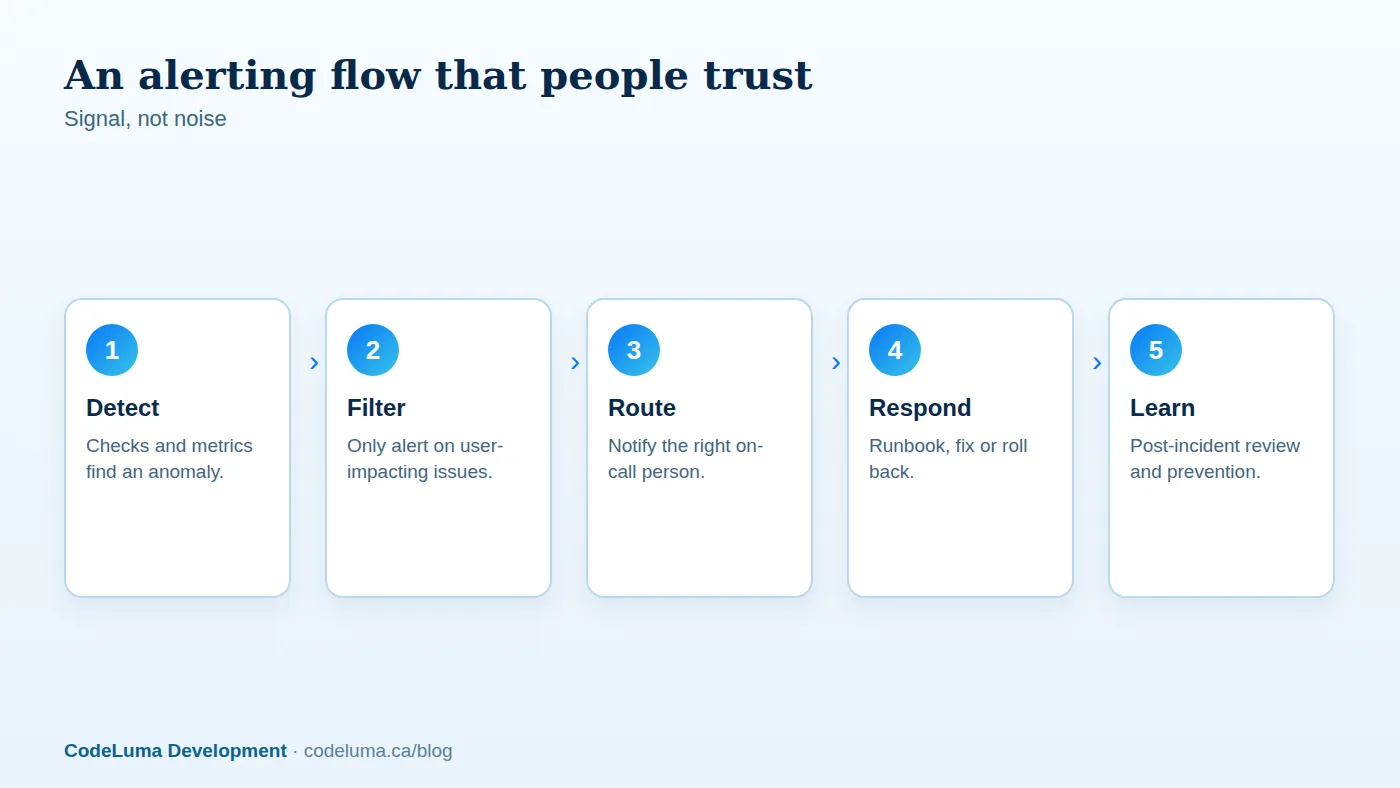
Alert fatigue is the enemy of monitoring. If people receive dozens of meaningless alerts, they ignore them, including the one that matters. Follow these principles:
- Alert on symptoms that affect users, such as errors, failed checkouts and high latency, rather than on every cause such as a CPU spike that harms nobody.
- Every alert must be actionable. If there is nothing to do, it is a dashboard item, not an alert.
- Use severity levels. Page a person for urgent issues; send lower-priority issues to a channel or ticket queue for working hours.
- Add thresholds with duration, such as "error rate above two percent for five minutes," to avoid flapping.
- Attach context and links to dashboards and runbooks in the alert.
- Route to the right person with an on-call schedule and escalation if unacknowledged.
Runbooks and incident response
For common problems, write short runbooks: how to check, likely causes, how to mitigate, and whom to call. During an incident, assign one incident lead, communicate status regularly to stakeholders and customers, and prioritise restoring service over finding the perfect cause. Afterwards, hold a blameless review: what happened, why detection took as long as it did, what will prevent recurrence. Turn findings into concrete changes, such as a new check, a code fix or a process improvement.
Right-size the setup
A small business does not need an enterprise observability stack. A practical baseline is external uptime monitoring with SSL and domain checks, an error-tracking service for front and back ends, basic server and database metrics with a few alerts, log retention for at least a few weeks, and a weekly review of trends. Add real-user monitoring and tracing as complexity grows. Many hosted tools offer generous free or low-cost tiers suitable for early-stage products.
Include monitoring in every project
Monitoring is far easier to include from the start than to bolt on after an outage. Add health endpoints, structured logging, error tracking and dashboards to the definition of done for new features. Include release markers so you can correlate problems with deployments. If you would rather not run this yourself, a maintenance and monitoring plan puts experienced people on the receiving end of the alerts.
Put this into practice with CodeLuma
CodeLuma sets up monitoring, alerting and incident routines for the applications we build and maintain, so problems are found and fixed before your customers notice.
- Maintenance and support plans - updates, monitoring and ongoing improvement.
- Custom software development - tailored systems, integrations and internal tools.
- Managed hosting - monitored, backed-up, Canadian-friendly hosting.
Start a conversation. Tell us about your project and we will reply with practical next steps, or browse all CodeLuma services. CodeLuma Development Inc. is a Canadian company that works with teams in Windsor, Essex, London, Toronto, Mississauga and across Ontario, throughout Canada and remotely.