Largest Contentful Paint, or LCP, measures how long it takes the biggest visible element on a page to finish rendering. It is one of Google's Core Web Vitals, and it is usually the metric that makes a page feel "slow" even when everything else is technically fine. The good news is that LCP problems are almost always traceable to one specific element on the page. Find that element, understand why it is slow, and you have a clear, fixable brief for your development team.
What LCP Actually Measures
LCP tracks the render time of the largest content element within the visible viewport as the page loads. That is usually a hero image, a banner, a video poster frame, or sometimes a large block of text. It is not an average of everything on the page. It is a single element, and that is what makes it practical to diagnose: you are not chasing a vague "slowness" feeling, you are chasing one identifiable thing.
Google currently considers 2.5 seconds or less a good score, with anything past 4 seconds flagged as poor. These thresholds can shift over time, so always check current guidance rather than treating these numbers as fixed.

Why This Metric Matters to a Business, Not Just a Developer
LCP is a ranking signal and a usability signal at the same time. A slow hero element means visitors stare at a blank or partially loaded page during the moment that is supposed to make a first impression, whether that is a product shot, a homepage banner, or a headline. For teams thinking about how performance affects conversion, LCP is often the single most visible symptom of a page that is working against itself.
It is also one of the few performance metrics a non-technical stakeholder can verify themselves, in a browser, in under a minute. That makes it a good shared language between business owners and developers.
Step One: Identify the LCP Element on Each Key Page
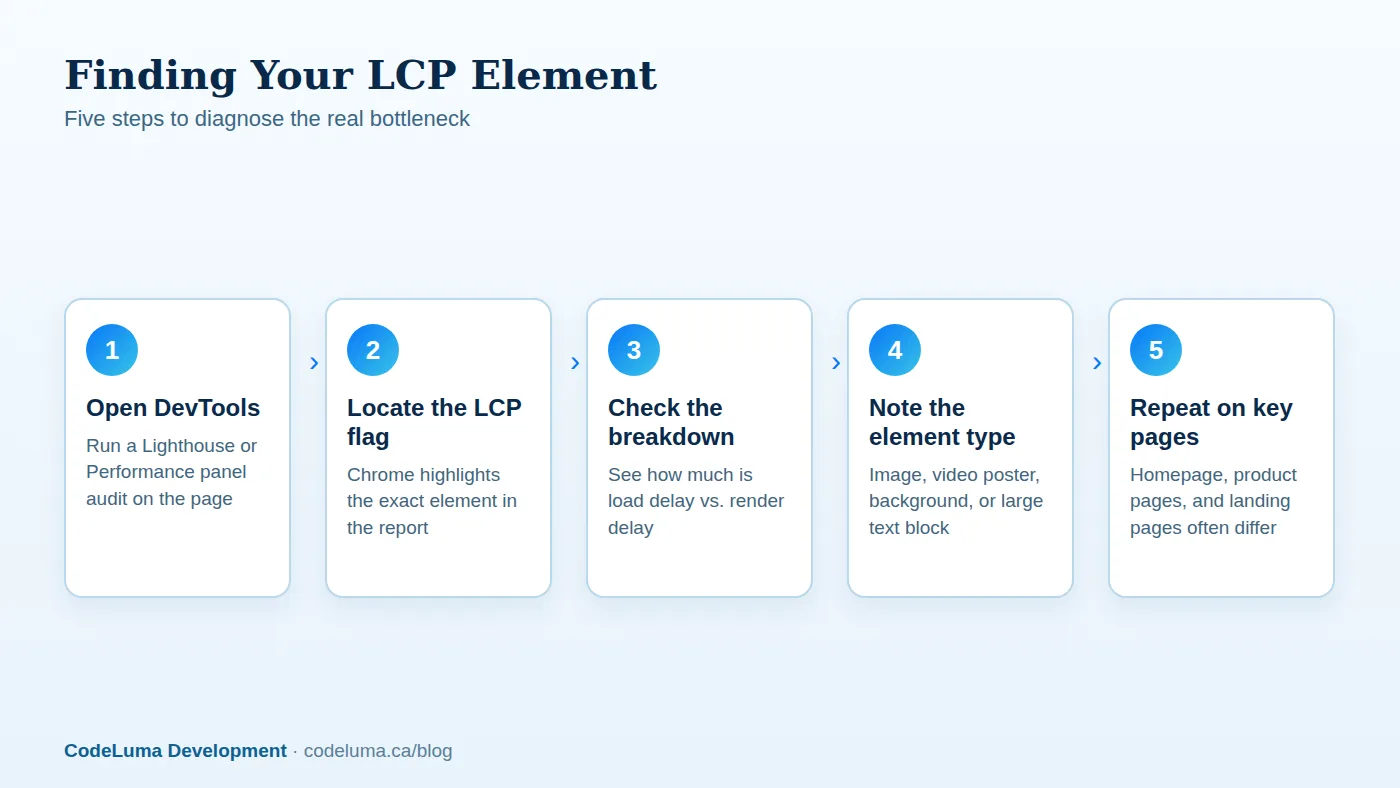
Open Chrome DevTools, go to the Lighthouse panel, and run an audit. The report will name the LCP element directly and let you hover to highlight it on the page. Alternatively, the Performance panel lets you record a page load and inspect the LCP marker on the timeline, which also shows you when the element started loading versus when it finished rendering.
Do this for every page type that matters to the business, not just the homepage. Product pages, landing pages, and blog templates often have completely different LCP elements and different bottlenecks. A fix that helps the homepage does nothing for a product page with a different hero structure.
Step Two: Separate Load Delay from Render Delay
Lighthouse breaks the LCP timing into phases: time to first byte, resource load delay, resource load time, and render delay. This breakdown matters because it tells you where the time is actually going. If most of the delay happens before the browser even starts downloading the image, the problem is likely server response time or render-blocking resources earlier in the page. If the delay is in the image loading itself, the problem is the asset.
Handing a developer "LCP is slow" is not actionable. Handing them "the hero image starts downloading 1.8 seconds late because of a render-blocking stylesheet" is a brief they can act on immediately.
Common Cause: An Unoptimized Hero Image
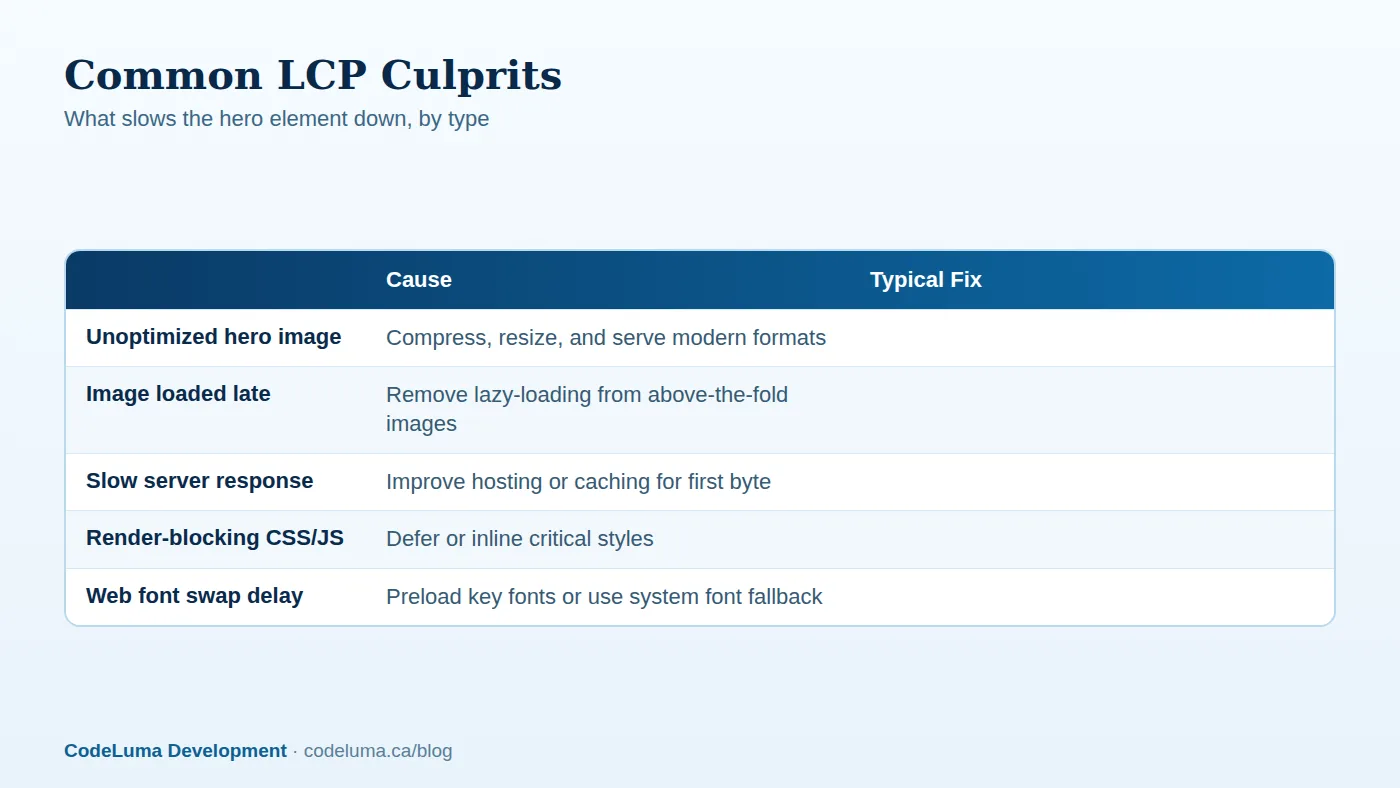
This is the most frequent culprit. A hero image exported at full camera resolution, saved as an uncompressed JPEG or PNG, can easily be five to ten times larger than it needs to be. Modern formats like WebP or AVIF, combined with proper resizing for the actual display dimensions, routinely cut hero image weight dramatically without a visible quality loss.
Ask your developer to confirm the image is served at the size it is actually displayed, not scaled down by CSS from a much larger source file.
Common Cause: Lazy-Loading Applied to the Wrong Image
Lazy-loading is good practice for images further down the page, but it is a common mistake to apply it to the hero image itself. If the browser is told to defer loading an image until it is near the viewport, and that image is the LCP element, you have manually created the exact delay you are trying to remove. The fix is simple: the hero image should load eagerly and, ideally, be preloaded.
Common Cause: Slow Server Response Time
If the time to first byte is high, no amount of image optimization will fix the LCP score, because the browser cannot start rendering anything until the HTML document itself arrives. This points to hosting, caching, or backend performance rather than the asset itself. This is one of the few LCP issues that lives outside the front-end code entirely, which is why managed hosting configuration is worth reviewing alongside the page itself.

Common Cause: Render-Blocking CSS and JavaScript
Stylesheets and scripts that load before the hero element can delay rendering even when the image itself downloads quickly. Critical CSS needed for the above-the-fold layout should be inlined or prioritized, while non-essential scripts should be deferred so they do not sit in the critical path. This is a frequent issue on pages built with heavier page builders or accumulated plugins, where scripts pile up over time without anyone auditing what is actually required early in the load.
Common Cause: Web Font Loading Delays
If the LCP element is a text block rather than an image, custom web fonts can introduce a delay while the browser waits for the font file before it will render the text, or swaps a fallback font in and out. Preloading the key font file, or using `font-display: swap` thoughtfully, keeps text visible sooner even if the final font arrives a moment later.
A Short Checklist Before You Brief Your Developer
- Run Lighthouse on each key page template and screenshot the LCP element it flags
- Note whether the delay is mostly load delay or render delay
- Check the image format, dimensions, and whether it is compressed
- Confirm the hero image is not set to lazy-load
- Check time to first byte separately from the rest of the page
- List any CSS or JavaScript loading before the hero element
- Flag custom fonts used in large above-the-fold text
Mistakes to Avoid
The most common mistake is optimizing in the wrong order: compressing images on a page where the real problem is server response time, or rewriting backend caching when the actual issue is a 4MB PNG. Always confirm the diagnosis with the Lighthouse breakdown before committing development time to a fix.
Another frequent mistake is testing only on a fast connection or a cached state. LCP numbers can look very different on a throttled mobile connection with an empty cache, which is closer to what a real first-time visitor experiences. Test under realistic conditions, not best-case ones.
Finally, treating this as a one-time fix rather than something to monitor is a missed opportunity. New content, new plugins, and new marketing banners can all quietly reintroduce LCP problems after the original fix. Ongoing checks, whether through a maintenance plan or periodic audits, catch regressions before they affect real visitors.
Wrapping Up
LCP is one of the more approachable performance metrics precisely because it points to a single, identifiable element rather than a vague sense that a page is slow. Spend the few minutes it takes to find that element on each key page, understand whether the delay is happening before or during its load, and you will have a specific, actionable brief instead of a general complaint. That specificity is what actually gets fixes shipped.
Put this into practice with CodeLuma
CodeLuma can audit your key pages, identify the exact LCP element slowing each one down, and implement the fix, whether that's image delivery, server response time, or render-blocking code. This fits naturally alongside our broader {{svc:web|website and web application development}} work.
- Website and web application development - fast, accessible, search-friendly builds.
- Managed hosting - monitored, backed-up, Canadian-friendly hosting.
- Maintenance and support plans - updates, monitoring and ongoing improvement.
- CodeLuma support - help from a real team when you need it.
Start a conversation. Tell us about your project and we will reply with practical next steps, or browse all CodeLuma services. CodeLuma Development Inc. is based in Nova Scotia and works with teams across Canada and remotely.