If your Core Web Vitals report shows a red or amber score next to Interaction to Next Paint, you already know something feels slow — a menu that hesitates before opening, a form that lags after you click submit, an "add to cart" button that seems to think about it before responding. INP is Google's way of putting a number on that hesitation. This guide walks through what the metric actually measures, how to trace a poor score back to the specific click or tap handler causing it, and how to prioritize the fix with your development team without turning it into a months-long rewrite.
What Interaction to Next Paint Actually Measures
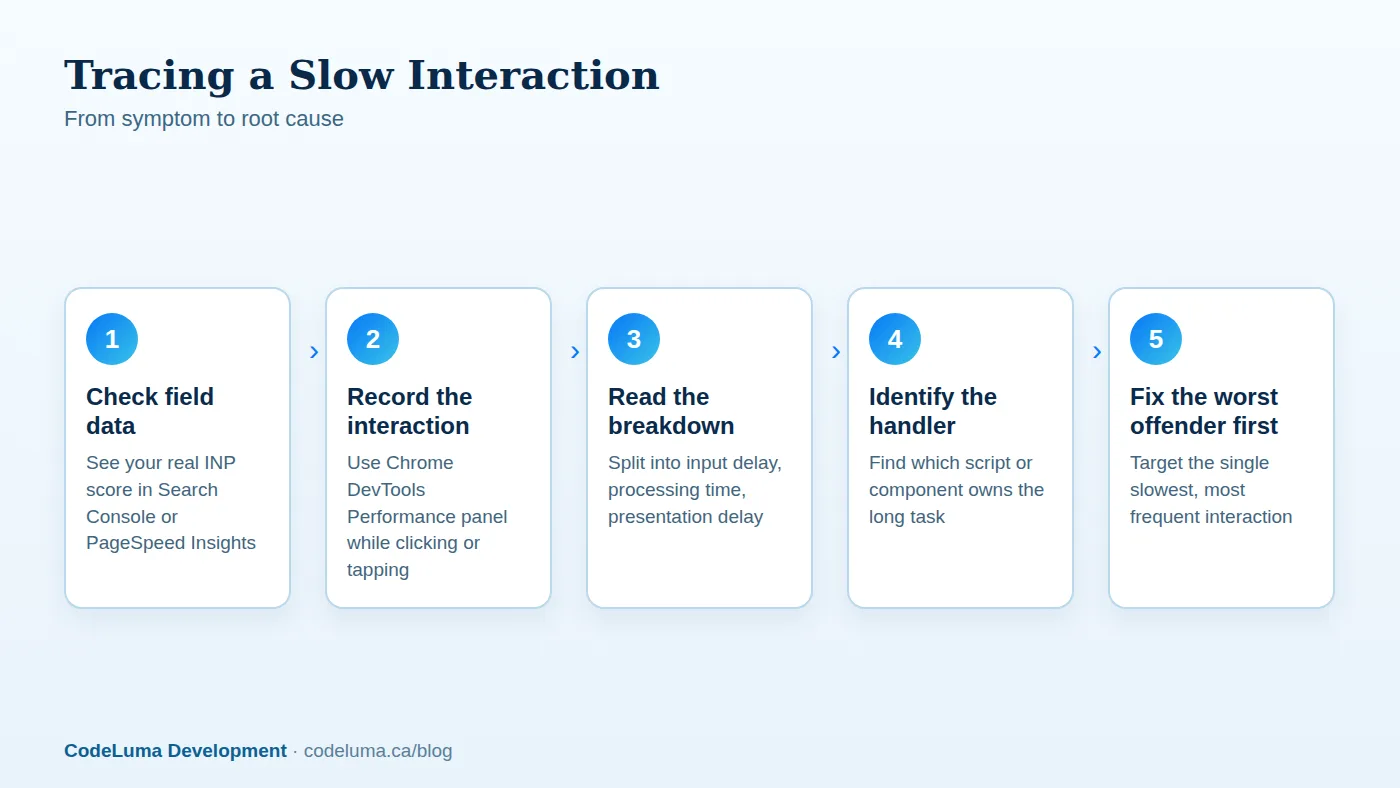
INP measures the time between a user interacting with your page — a click, tap, or key press — and the browser painting the next visual update that reflects that interaction. It's made up of three pieces: input delay (time waiting for the main thread to be free), processing time (how long your handler takes to run), and presentation delay (time to render the result). Google scores it against fixed thresholds: 200 milliseconds or under is good, up to 500 milliseconds needs improvement, and anything higher is considered poor.
Unlike a single snapshot metric, INP looks at every interaction a user makes during their visit and reports roughly the worst one. That matters, because it means one badly behaved dropdown or filter panel buried three clicks into a session can drag your whole score down, even if the homepage feels instant.
Why It's Harder to Ignore Than First Input Delay
INP replaced First Input Delay as an official Core Web Vital in 2024, and for good reason. FID only measured the delay before the browser could start handling the very first interaction on a page — usually a simple click that looks fine even on a site with deeper problems. INP tracks interactions throughout the entire session, including the ones that tend to be genuinely heavy: opening a filter panel, submitting a form, expanding an accordion, switching a tab in a dashboard. Those are exactly the interactions most likely to trigger a big JavaScript re-render, which is why sites that passed FID comfortably are now showing poor INP scores.
How to Check Your Current Score
Start with field data rather than a single test run, since INP is meant to reflect real users on real devices. Google Search Console's Core Web Vitals report and PageSpeed Insights both show field INP scores aggregated over the past 28 days, broken down by URL group. For deeper detail, the open-source web-vitals JavaScript library can be added to your own analytics so you capture INP per page, per device type, and — with its attribution build — per DOM element, which is the fastest way to see exactly what users are clicking when things go slow.
Lab tools like Chrome DevTools and Lighthouse are useful for reproducing a problem once you know roughly where to look, but they run on a single machine under artificial conditions, so treat them as a diagnostic aid rather than the source of truth on your actual score.
Tracing a Slow Interaction to Its Cause
Once you know a page has a poor INP score, open Chrome DevTools, switch to the Performance panel, start recording, and interact with the page the way a frustrated user would. The recording will highlight the interaction and break it into the same three phases Google scores: input delay, processing time, and presentation delay. Long processing time almost always points to a specific function or component doing more work than it needs to on the main thread at that exact moment.
If the problem only shows up for real users and not on your development machine, that's often a device or network story — a laptop with a fast processor can mask work that chokes a mid-range phone. That's one reason field data from actual visitors matters more than a single lab test.
What Usually Causes a Slow Interaction
In our experience working across different codebases, a handful of patterns show up again and again:
- Heavy JavaScript running synchronously inside the click handler — validation, formatting, or data processing that blocks the main thread before anything can render.
- Third-party scripts — chat widgets, analytics tags, and ad scripts that attach their own global click listeners and compete for the main thread at the worst possible moment.
- Large, unnecessary re-renders — a framework re-rendering a big chunk of the page when only a small part actually changed.
- Layout thrashing — reading and writing layout properties back to back in the same function, forcing the browser to recalculate layout multiple times.
- Unthrottled handlers — code that fires on every keystroke or scroll event without debouncing, piling up work faster than the browser can process it.
Fixing Long JavaScript Tasks
The core idea is to stop blocking the main thread for long stretches. Break large handlers into smaller pieces and yield control back to the browser between them so it can paint and respond to other input. Move genuinely heavy computation — large sorts, data transforms, image processing — off the main thread with a web worker. Defer anything that isn't needed for the immediate visual response, like analytics logging or non-critical follow-up requests, using a low-priority scheduling method instead of running it inline with the click handler. And add debouncing or throttling to handlers that fire repeatedly, such as search-as-you-type or scroll-triggered logic.
Fixing Layout and Rendering Delays
On the rendering side, look for components re-rendering more of the page than the interaction actually changed — memoizing components or narrowing what state updates trigger a re-render is usually the fix. Batch DOM reads and writes instead of interleaving them, since alternating between the two forces the browser to recalculate layout repeatedly. Virtualizing long lists so only visible rows exist in the DOM, and keeping interactive component trees shallow, both reduce the amount of work the browser has to do between your click and the next paint. This kind of work overlaps heavily with general front-end performance, which is part of why we treat it as a core part of web development rather than a separate specialty.
Dealing With Third-Party Scripts
Third-party code is one of the most common and most overlooked causes of poor INP, because it's not something your own team wrote and it's easy to forget is even running. Audit what's actually loaded on your key pages — chat widgets, heatmap and session-recording tools, and ad tags are frequent offenders since they often attach listeners to clicks across the whole page. Where possible, load these scripts lazily, delay them until after the first meaningful interaction, or replace a heavy embed with a lightweight facade that only loads the full widget when a user actually engages with it.
Prioritizing Fixes With Your Development Team
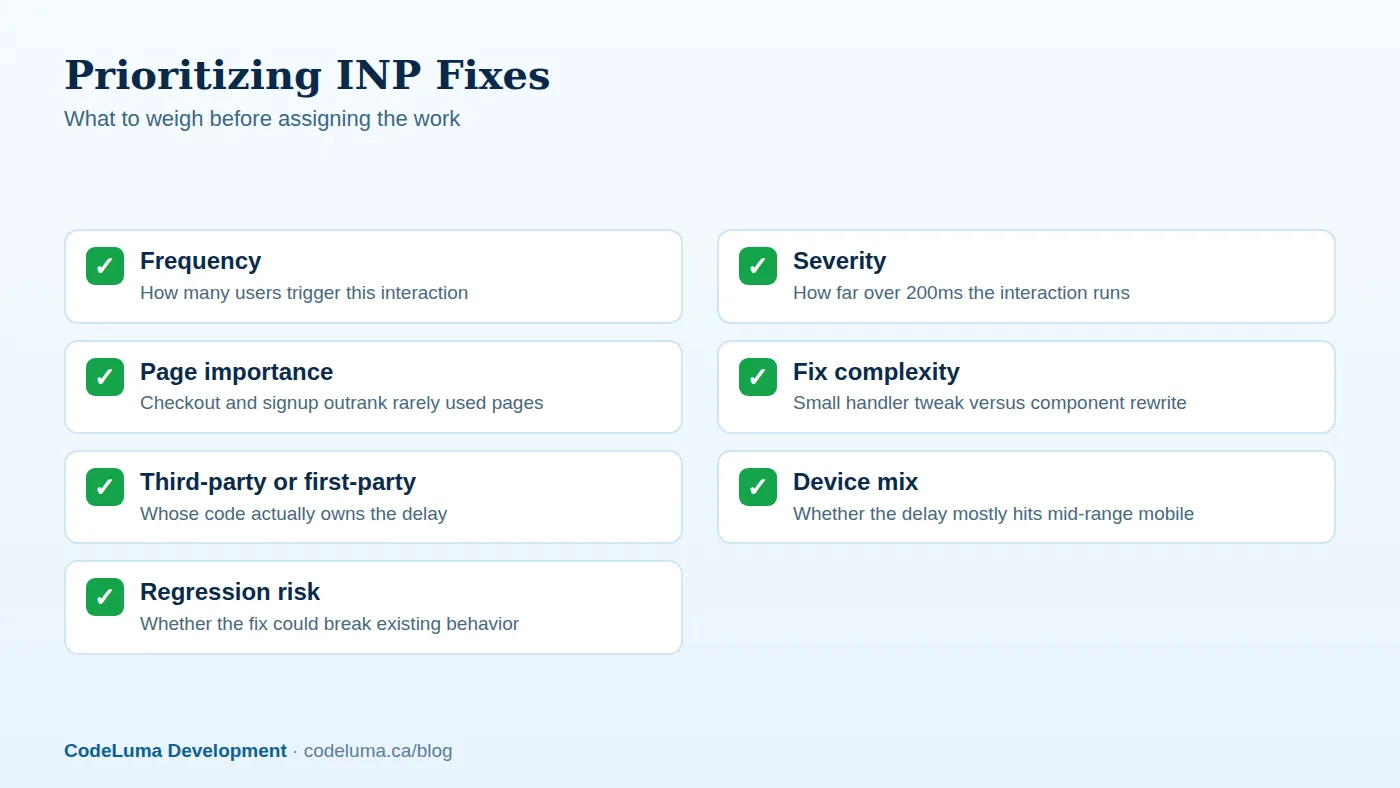
Not every slow interaction deserves the same urgency, and trying to fix all of them at once is how a two-week performance pass turns into a two-month rewrite. Rank problems by how often users hit the interaction, how far over the 200ms threshold it runs, and how important the page is to your business — a laggy checkout button matters more than a laggy footer link. Weigh that against how complex the fix actually is: some of the biggest wins come from a single debounced handler or a lazy-loaded script, not a component rewrite. If your team doesn't have spare capacity to work through this list methodically, it's a reasonable thing to hand to a partner already familiar with custom software development and performance tuning, rather than squeezing it in between feature work.
Common Mistakes When Chasing INP
- Testing only on a fast desktop. Most real interactions happen on mid-range mobile devices, which surface delays a development laptop never will.
- Chasing the lab score instead of the field score. A great Lighthouse run doesn't guarantee real users are having a good experience.
- Rewriting broadly instead of fixing the worst offender first. One badly behaved dropdown often accounts for most of the damage to your score.
- Adding more JavaScript to fix a JavaScript problem. Performance libraries and polyfills can quietly make the main thread busier, not less.
- Treating it as a one-time project. New features and third-party scripts get added constantly, so INP needs to be watched on an ongoing basis, not just fixed once and forgotten.
Wrap-Up
INP rewards the same discipline as any other performance work: measure with real data first, trace the problem to its actual cause instead of guessing, and fix the handful of interactions doing the most damage before worrying about the rest. None of this requires a framework migration or a full redesign — most meaningful improvements come from trimming what runs inside a handful of click handlers and reining in what third-party scripts are allowed to do. If your team wants a second set of eyes on where your interactions are actually breaking down, that kind of audit fits naturally alongside our ongoing maintenance and support work, where performance gets checked as part of keeping a site healthy rather than as a one-off fire drill.
Put this into practice with CodeLuma
CodeLuma can profile your site's real interactions, trace a poor INP score back to the specific handler or third-party script causing it, and fix the worst offenders without a ground-up rebuild. If you'd rather hand off ongoing monitoring, our {{svc:maintenance|maintenance plans}} keep an eye on Core Web Vitals over time instead of leaving it as a one-time audit.
- Website and web application development - fast, accessible, search-friendly builds.
- Maintenance and support plans - updates, monitoring and ongoing improvement.
- Custom software development - tailored systems, integrations and internal tools.
- CodeLuma support - help from a real team when you need it.
Start a conversation. Tell us about your project and we will reply with practical next steps, or browse all CodeLuma services. CodeLuma Development Inc. is based in Nova Scotia and works with teams across Canada and remotely.