About this article: this is a representative, composite walk-through of a common scenario rather than a report about one named client. The figures are illustrative. The techniques, however, are exactly the ones that resolve most slow-dashboard problems in practice.
The scenario
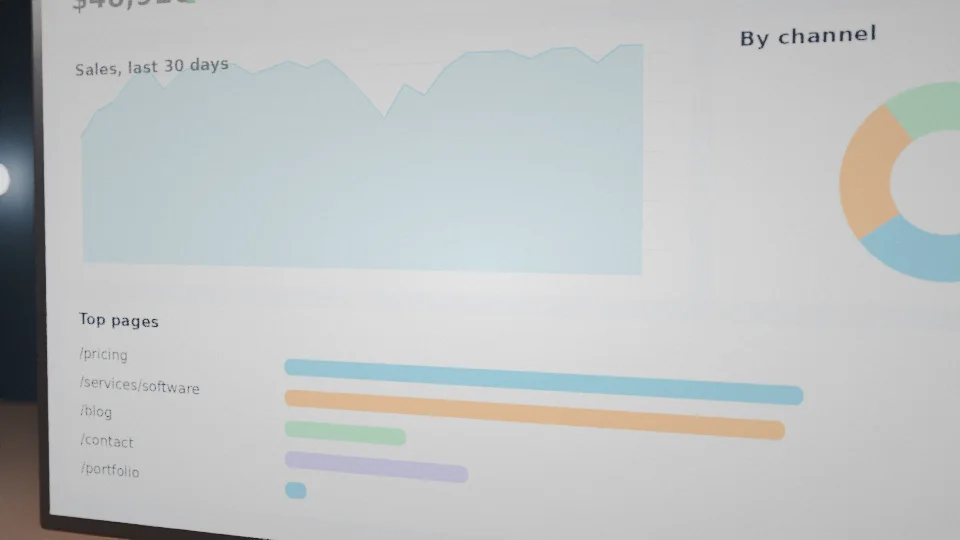
A growing business has a management dashboard that once loaded instantly. Two years and several hundred thousand records later, it takes more than ten seconds and sometimes times out. Staff avoid it, developers say the server is "too small," and the hosting bill has crept up as the team upgraded the instance twice to compensate. The dashboard shows totals by month, top customers, recent orders and outstanding invoices. Nothing exotic, just a lot of data and a set of queries that were written when the tables were small.
Step one: measure before touching anything
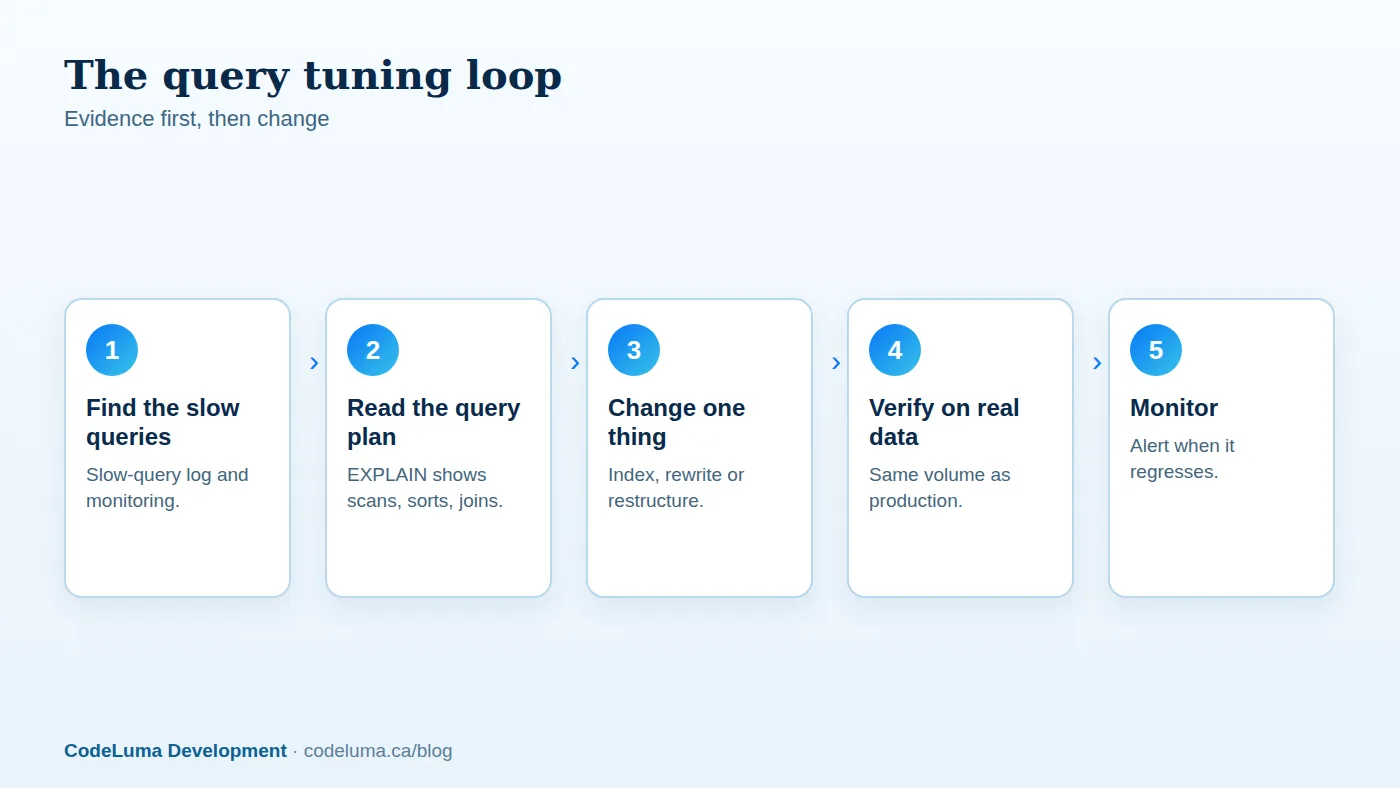
The first rule of optimisation is to find out what is actually slow. We enable the database's slow-query log and application performance monitoring, then load the dashboard while watching what happens. A single page load fires 340 queries, and three of them account for over eighty percent of the database time. That is typical: a few queries do most of the damage, and guessing at the rest wastes effort.
Step two: read the query plan
For each slow query we run EXPLAIN, which shows how the database plans to execute it. Three problems appear immediately. One query filters orders by customer and date but has no useful index, so the database scans the whole table. Another sorts a large result set on an unindexed column, forcing a costly temporary sort. A third joins several tables on columns that are not indexed, multiplying the work. We look for full table scans on large tables, filesorts and temporary tables, join order problems and unusually high row estimates.
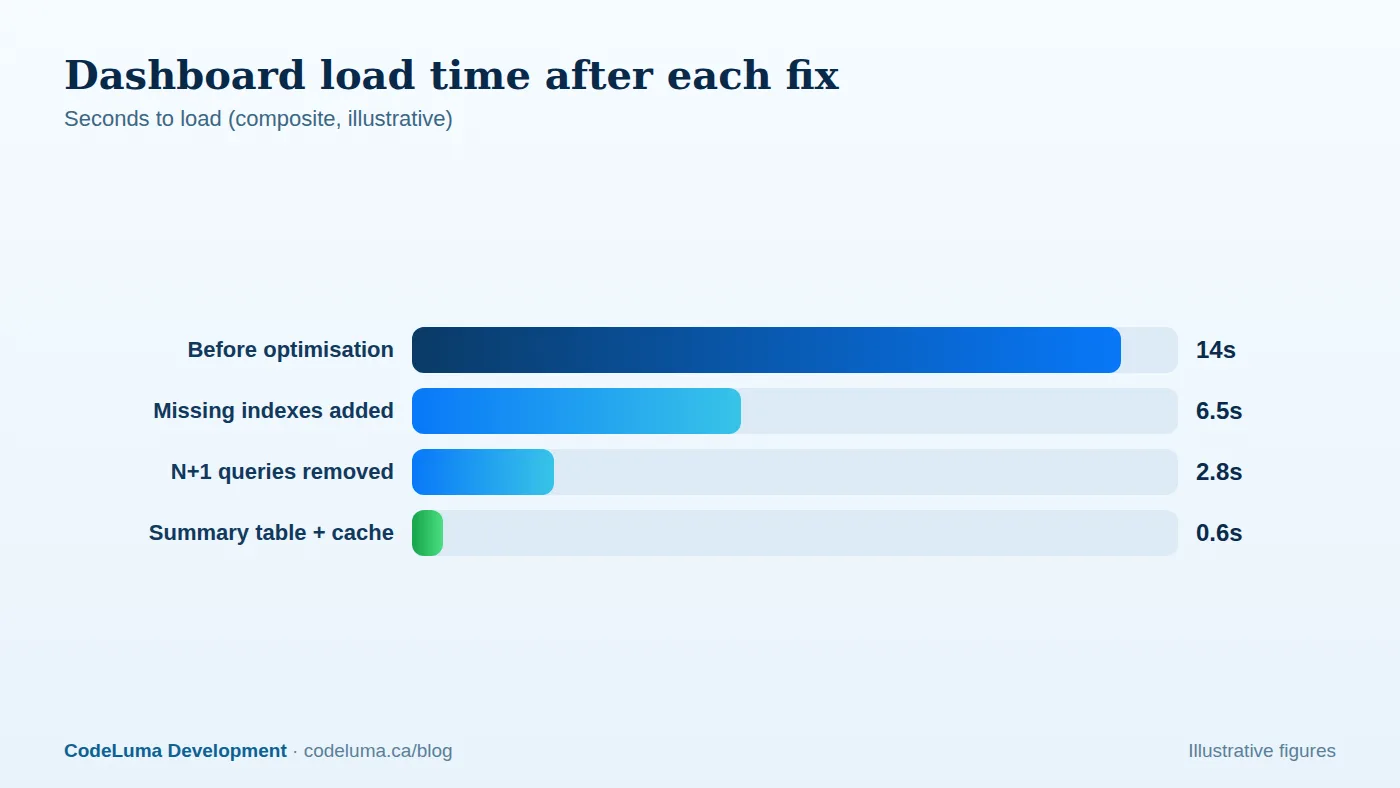
Step three: add the right indexes (14 s to about 6.5 s)
We add a composite index matching the filter and sort order of the main orders query, and indexes on the join columns. Column order matters: put equality filters first, then range or sort columns. After adding them, the query plan switches from a scan of hundreds of thousands of rows to a targeted index lookup. We test the effect on a copy of the production data, since a query that is fast on a hundred rows can be slow on ten million, and vice versa. We also remove two redundant indexes, because every index slows writes and consumes storage.
Step four: eliminate N+1 queries (6.5 s to about 2.8 s)
The recent-orders widget loads twenty orders and then, for each order, runs separate queries for the customer, the line items and the payment status. That is the classic N+1 problem: one query plus N more. We replace it with a small number of queries that fetch related data in batches, using joins or eager loading in the application framework. The count of queries on the page falls from 340 to about 25, and the time spent waiting on network round trips to the database drops dramatically.
Step five: restructure the heavy aggregates (2.8 s to 0.6 s)
Monthly totals, top-customer rankings and outstanding balances require summing many rows. Even with good indexes, computing them from raw data on every page view is wasteful. We introduce a summary table that stores pre-aggregated monthly figures, updated incrementally when orders and payments change, or refreshed on a schedule. The dashboard now reads a few dozen rows instead of aggregating hundreds of thousands. We also add short-lived application caching for the widgets that do not need to be real-time, and use stale-while-revalidate so users always see an instant response. These tactics are described more broadly in our caching guide.

Step six: fix the small things
- Select only the columns needed instead of pulling entire rows.
- Paginate long lists and add sensible limits.
- Replace functions on indexed columns in WHERE clauses, which prevent index use, with range conditions.
- Avoid wildcard searches with a leading percent sign on large text columns; use full-text search where appropriate.
- Run heavy exports and reports in background jobs instead of live requests.
The hosting outcome
With queries under control, database CPU drops sharply and the server has ample headroom. In a scenario like this, the business can often reverse the earlier upgrades and move back to a smaller, cheaper instance while getting a faster experience. Even if hosting spend does not fall immediately, the capacity you reclaim absorbs several times more growth before you must scale again. Fixing queries is usually far more cost-effective than buying bigger hardware, which only postpones the problem.
Prevent the slowdown from returning
- Monitor slow queries continuously and alert when a query exceeds a threshold or when overall database load climbs.
- Review queries in code review, especially anything that touches large tables or runs inside loops.
- Test with realistic data volumes in staging, not empty databases.
- Track growth: know your largest tables and plan archiving or partitioning for the ones that grow without bound.
- Keep statistics and maintenance current, including routine analysis and vacuuming for engines that need it.
When the problem is deeper
Sometimes the schema itself is the issue: heavily denormalised or over-normalised tables, JSON blobs that should be columns, or reporting queries running against the transactional database. Solutions include read replicas, a dedicated reporting store, or a redesigned data model. Those are bigger projects, and a structured review of your data layer will tell you whether they are warranted. If your dashboard has slowed down as your business grew, a focused database and performance review is one of the highest-return things you can do.
Put this into practice with CodeLuma
If a dashboard or report is slow, CodeLuma finds the queries responsible, fixes them at the source and often lets you downsize hosting, then adds monitoring so the slowdown never returns unnoticed.
- Custom software development - tailored systems, integrations and internal tools.
- Website and web application development - fast, accessible, search-friendly builds.
- Maintenance and support plans - updates, monitoring and ongoing improvement.
Start a conversation. Tell us about your project and we will reply with practical next steps, or browse all CodeLuma services. CodeLuma Development Inc. is a Canadian company that works with teams in Windsor, Essex, London, Toronto, Mississauga and across Ontario, throughout Canada and remotely.